From the archive · November 16, 2026
A 3½-year industrial slump that never became a recession has ended
We scored every Federal Reserve Beige Book since 1997. Industry is growing again in 10 of the 12 Fed districts, and none reports a decline.
We scored every Federal Reserve Beige Book since 1997. Industry is growing again in 10 of the 12 Fed districts, and none reports a decline.
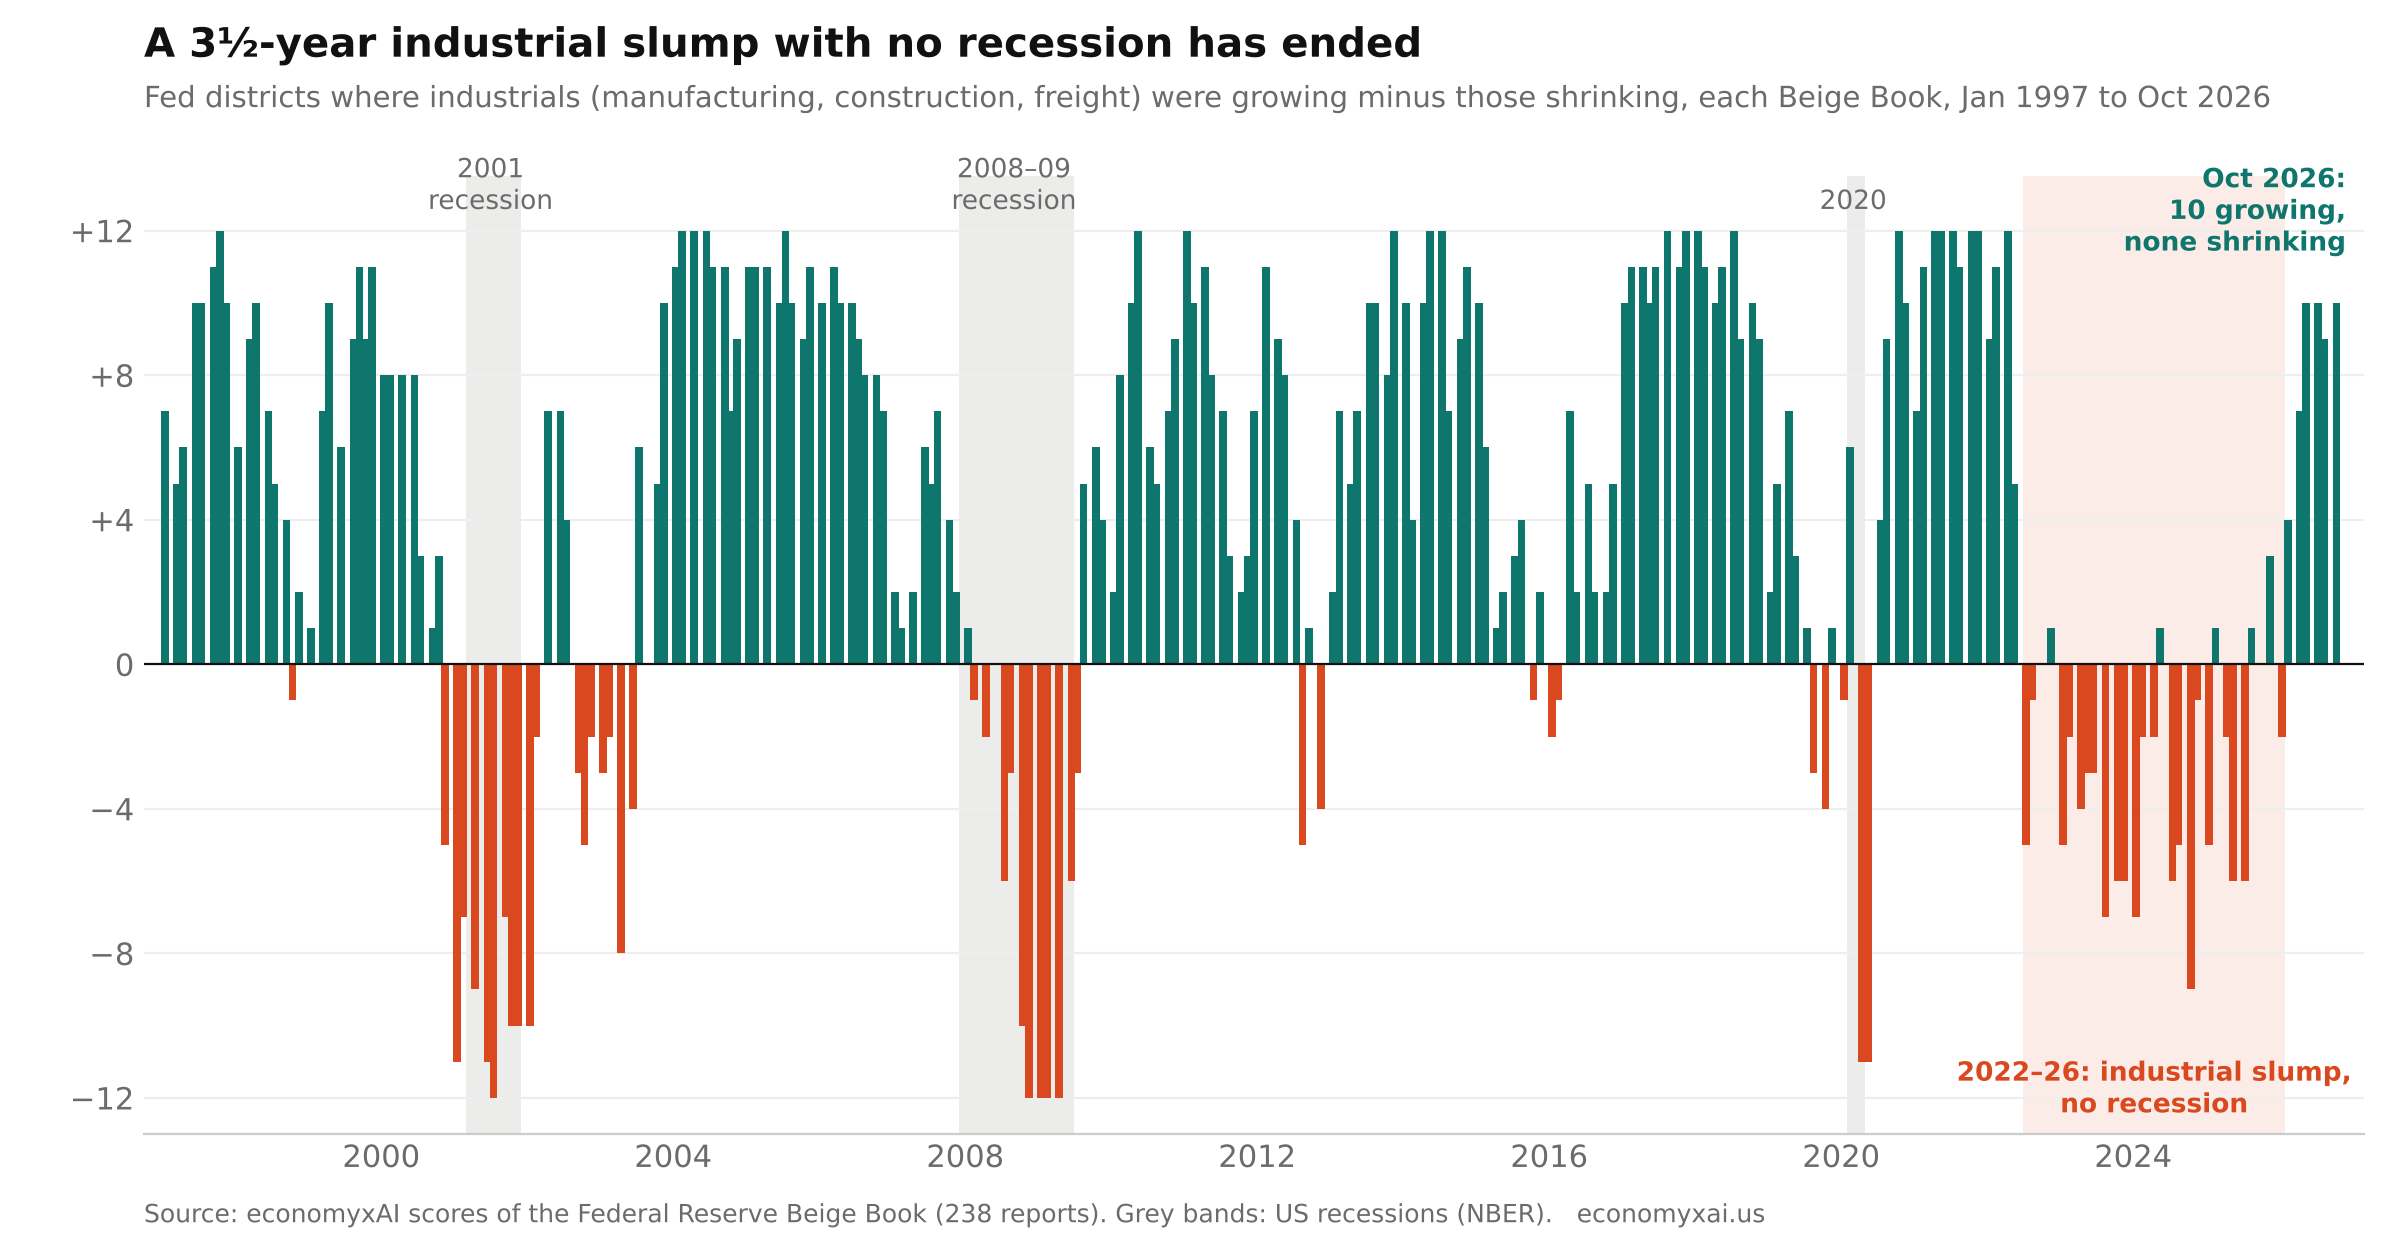
Cite: EconomyxAI Sector Watch, “A 3½-year industrial slump that never became a recession has ended,” https://economyxai.us/findings/industrial-slump/ (published November 16, 2026, data through October 2026).
Download the chart (PNG) · free to use with credit
From mid-2022 to early 2026, US industry went through a long slump that the rest of the economy largely shrugged off. In 22 of the 29 Beige Books published from July 2022 to January 2026, more of the Fed’s 12 districts described industrial activity (manufacturing, construction and freight) as shrinking than growing. At the low point, in October 2024, 10 districts reported a decline and only 1 reported growth.
That is close to the depth of the industrial downturns around the 2001 and 2008–09 recessions and the 2020 shutdown. What differs is everything around it. In each of those three episodes, all 12 districts eventually described their overall economy as contracting. This time, more districts reported overall growth than decline in 21 of the 29 reports, and there was no recession. It is the deepest industrial slump in the record since 1997 that did not come with one.
The turn came this year. In October 2026, 10 districts reported growing industrial activity and none reported a decline. It was the fourth report in a row with no district shrinking, the first such run since early 2022. The October reports point to where the demand is coming from: Dallas described a sharp pickup in Texas production; in Philadelphia, more than two-thirds of manufacturers raised output; Cleveland cited data centers, power generation and defense.
What to watch on November 25, when the next report comes out: whether industry holds up as credit tightens. In October, four districts said banks had tightened lending standards as rates rose, and Dallas manufacturers, while still upbeat, were less optimistic than in midsummer.
Each district’s report is scored from −2 to +2 for each of 11 sectors. The chart shows, for every report since January 1997, the number of districts with a positive industrials score minus the number with a negative one, so it runs from −12 to +12. These are EconomyxAI’s readings of public Federal Reserve reports, not official Fed figures. See the methodology, the Industrials sector page and the district comparison.
Download the numbers (CSV), free to use with credit to EconomyxAI Sector Watch.