For journalists
US economic sectors and Fed regional data, free for reporters and editors. Charts and figures on this site may be used in news coverage with credit.
The latest read: October 2026
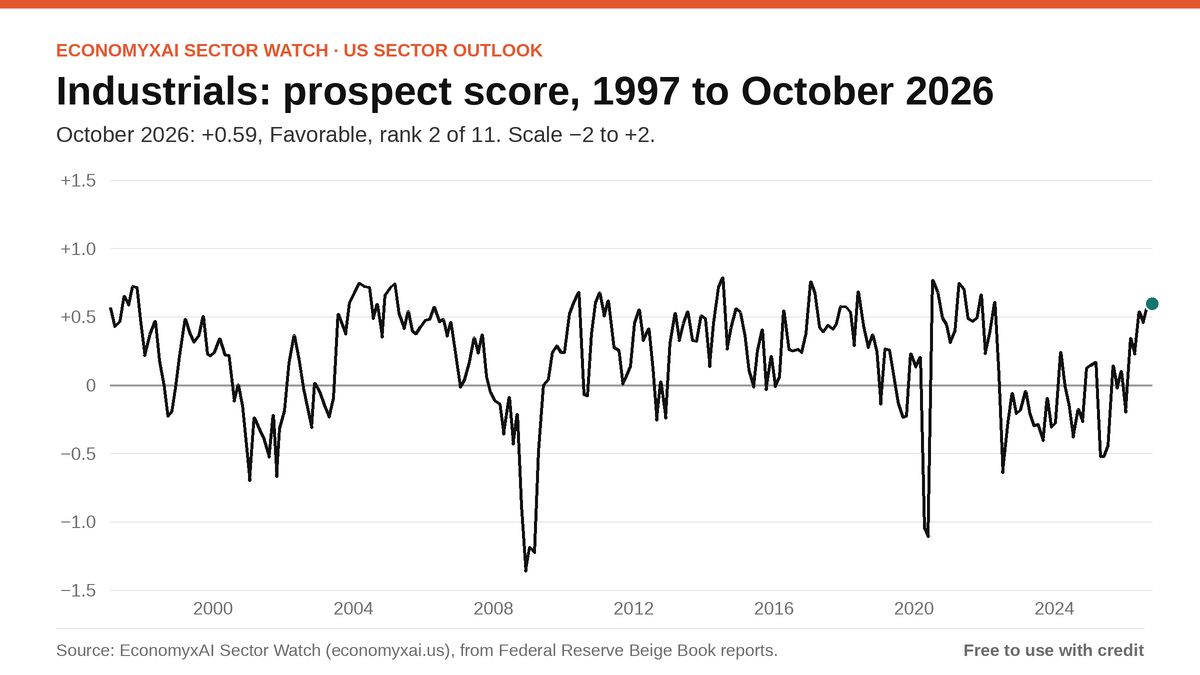
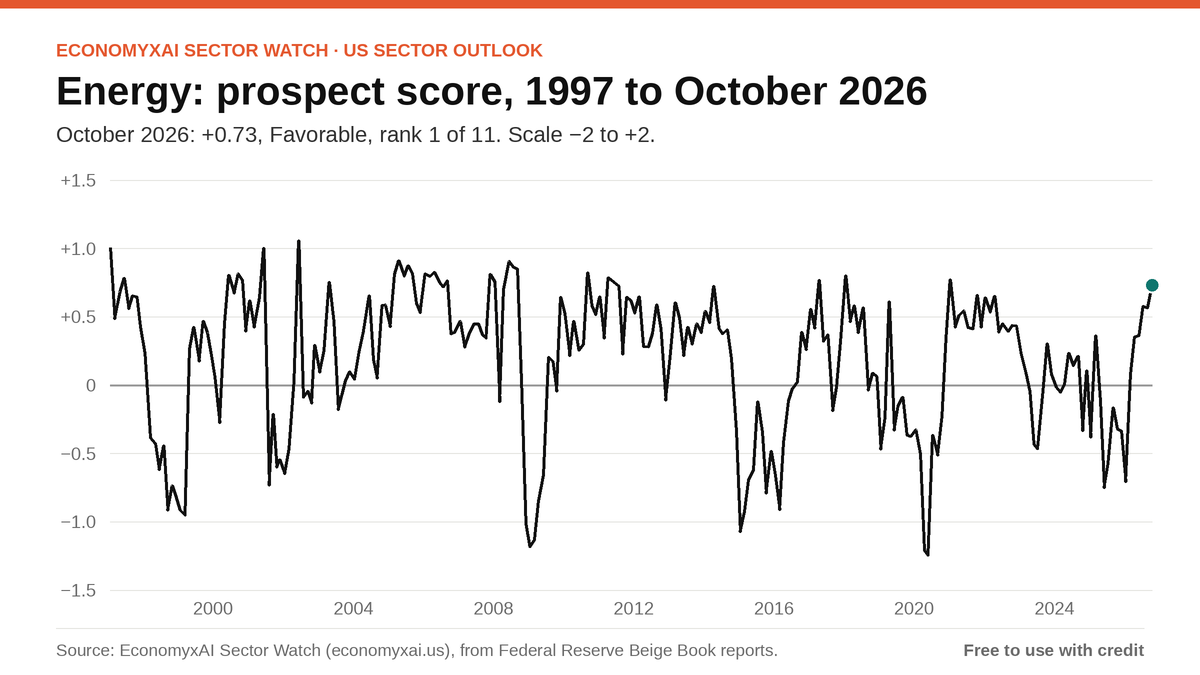
- Strongest sectors: Energy (+0.73) and Industrials (+0.59).
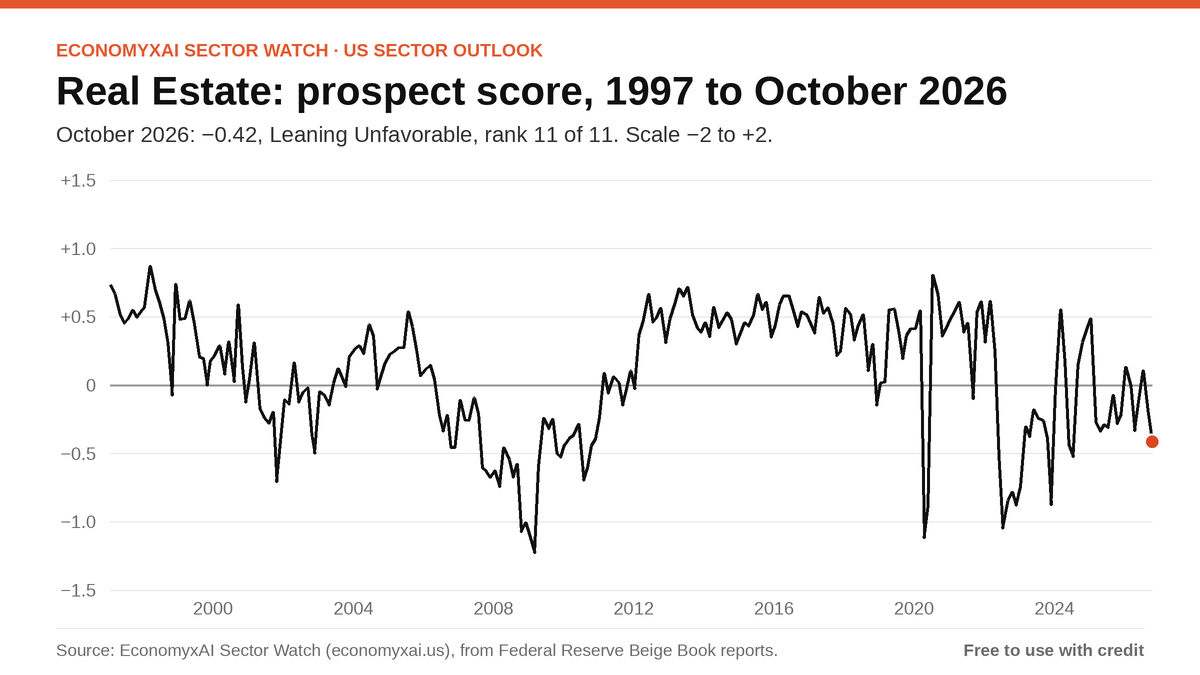
- Weakest sector: Real Estate (−0.42).
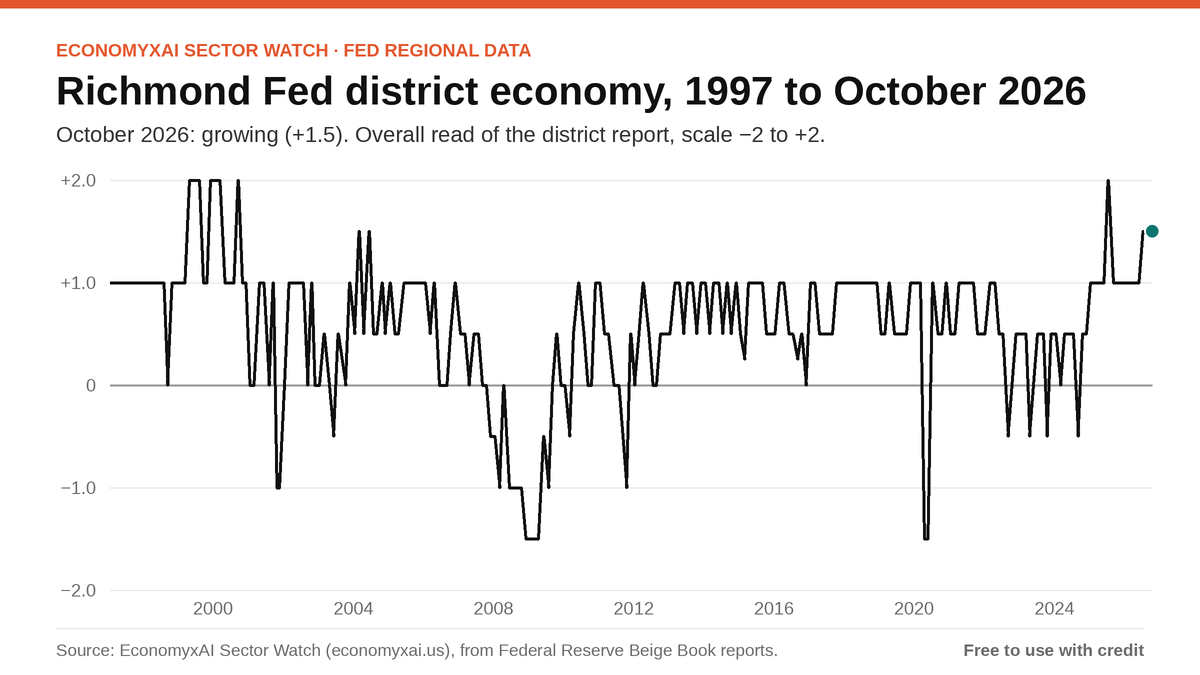
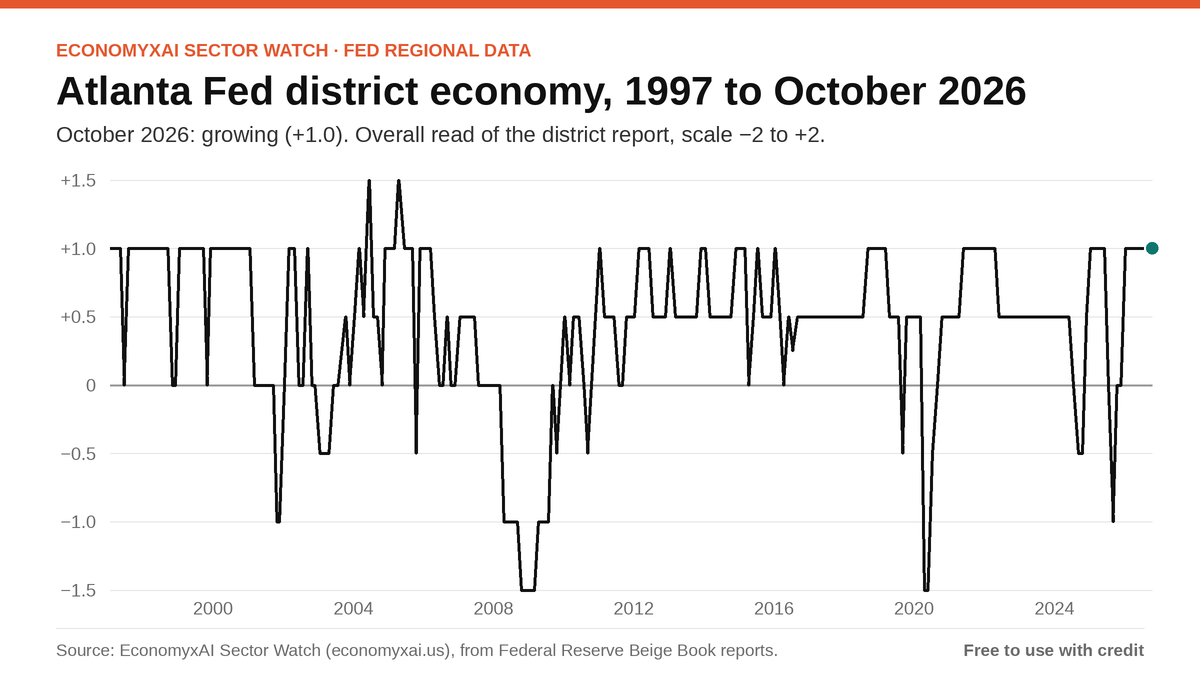
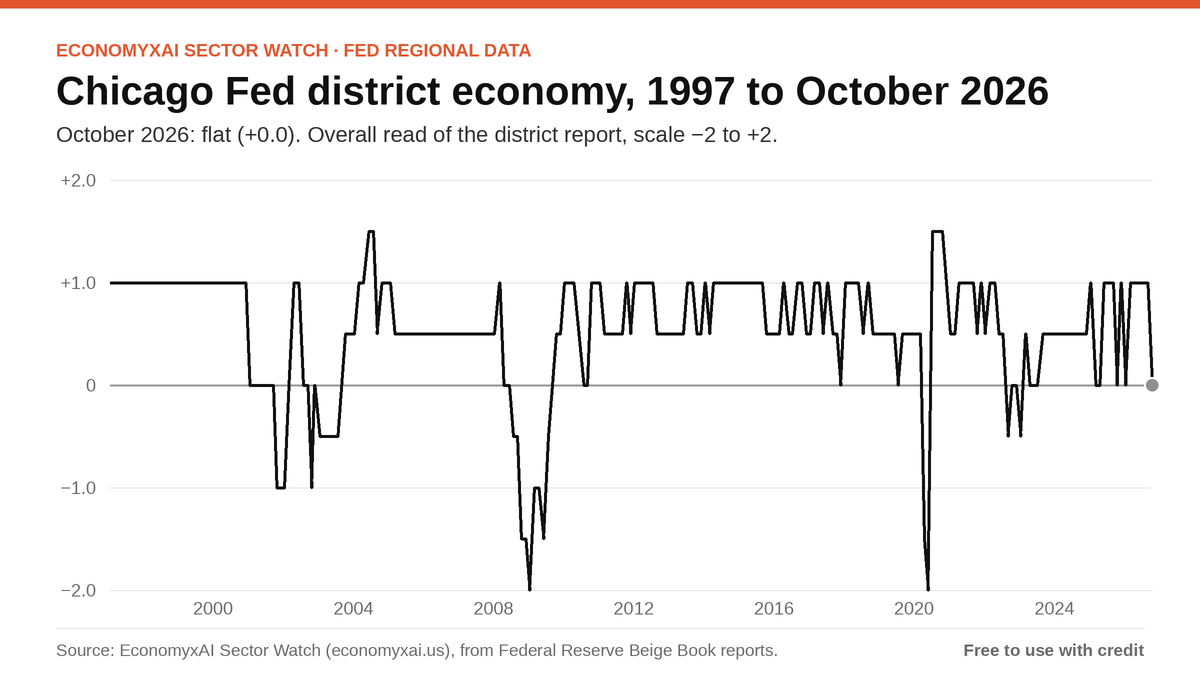
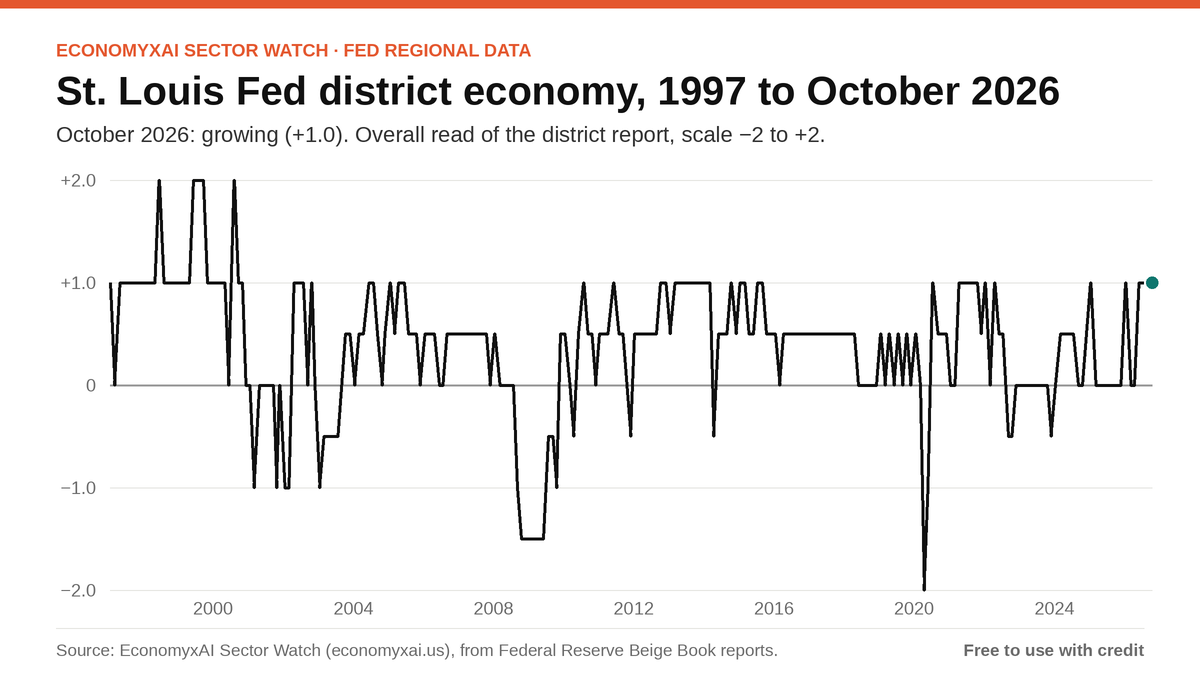
- 9 of 12 Federal Reserve districts growing.
Full detail: the October 2026 edition, the sector rankings and the district comparison.
What the data is
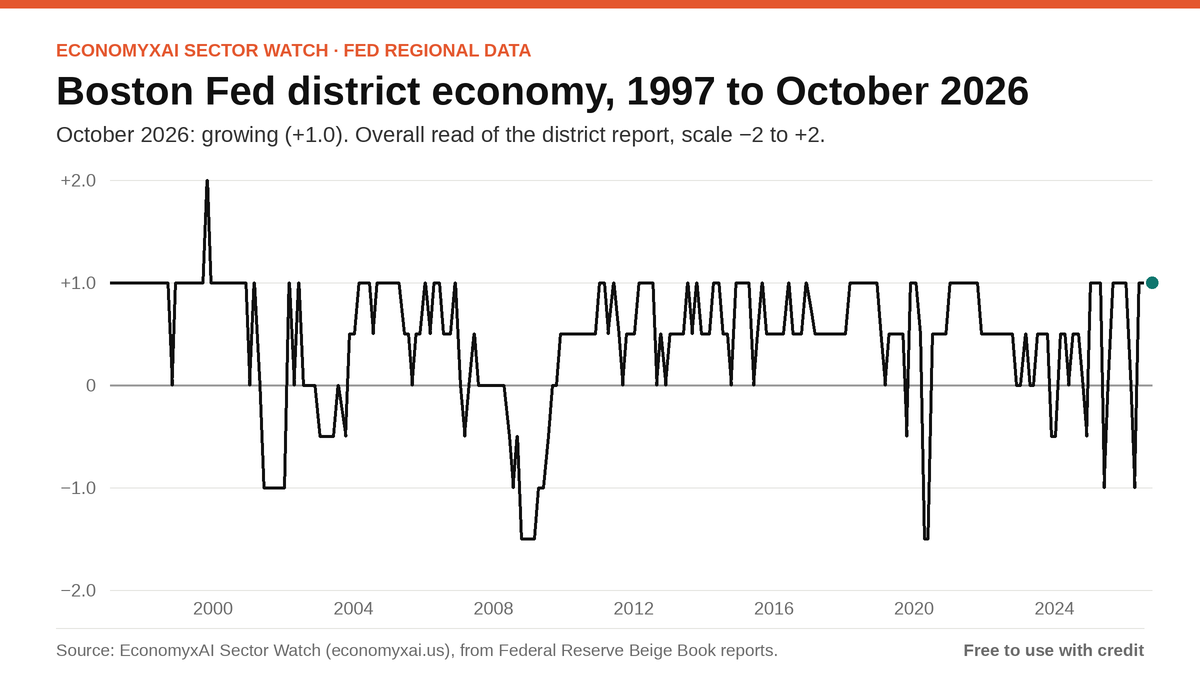
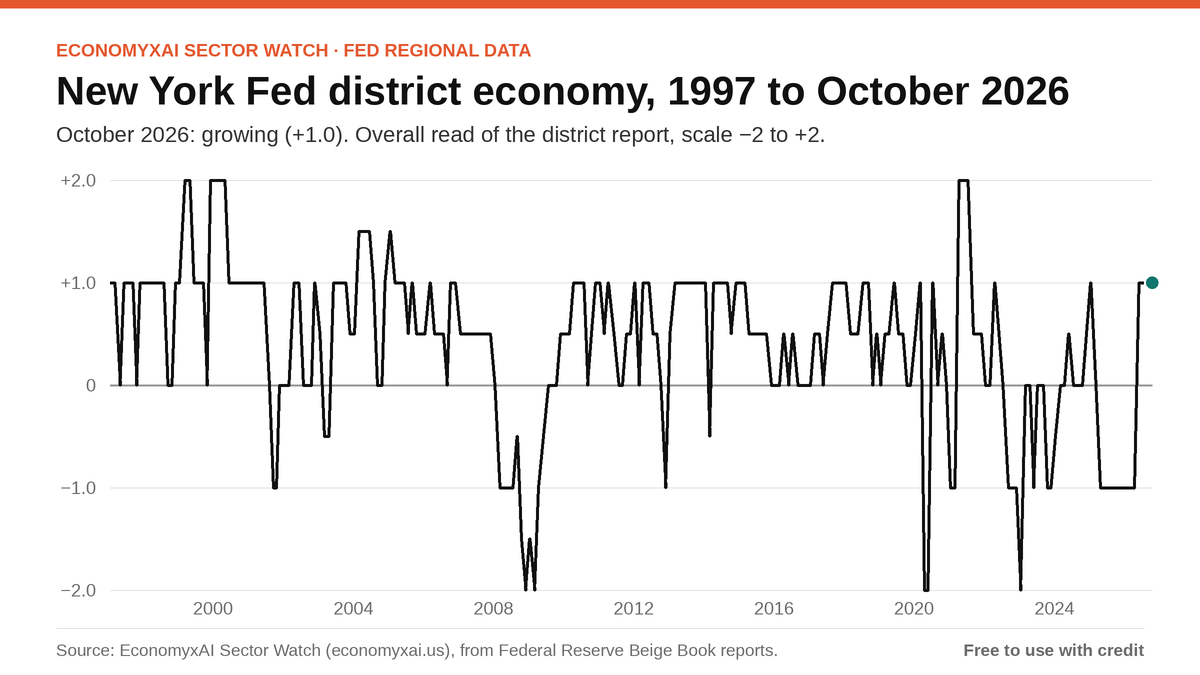
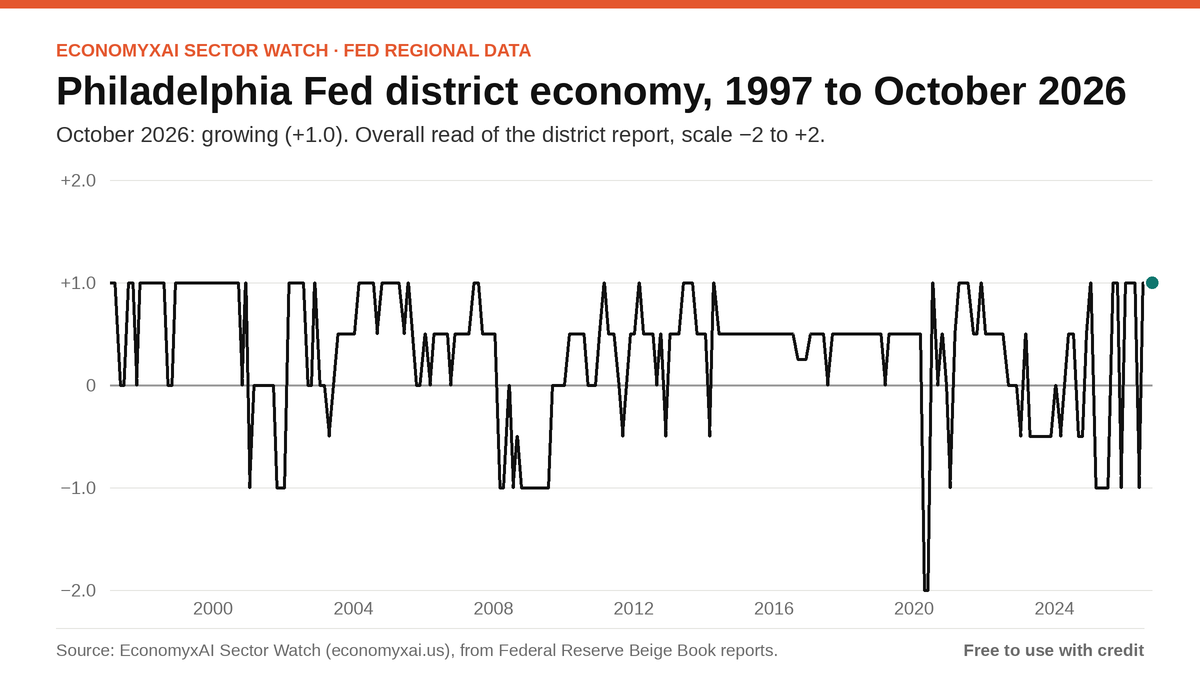
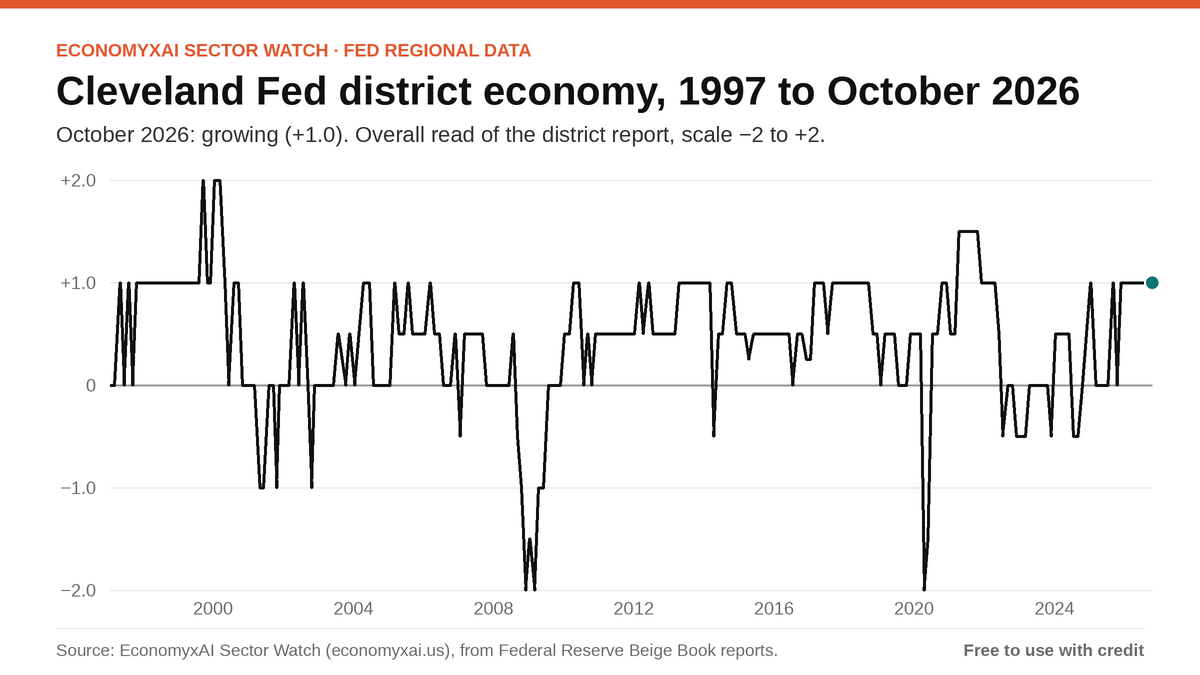
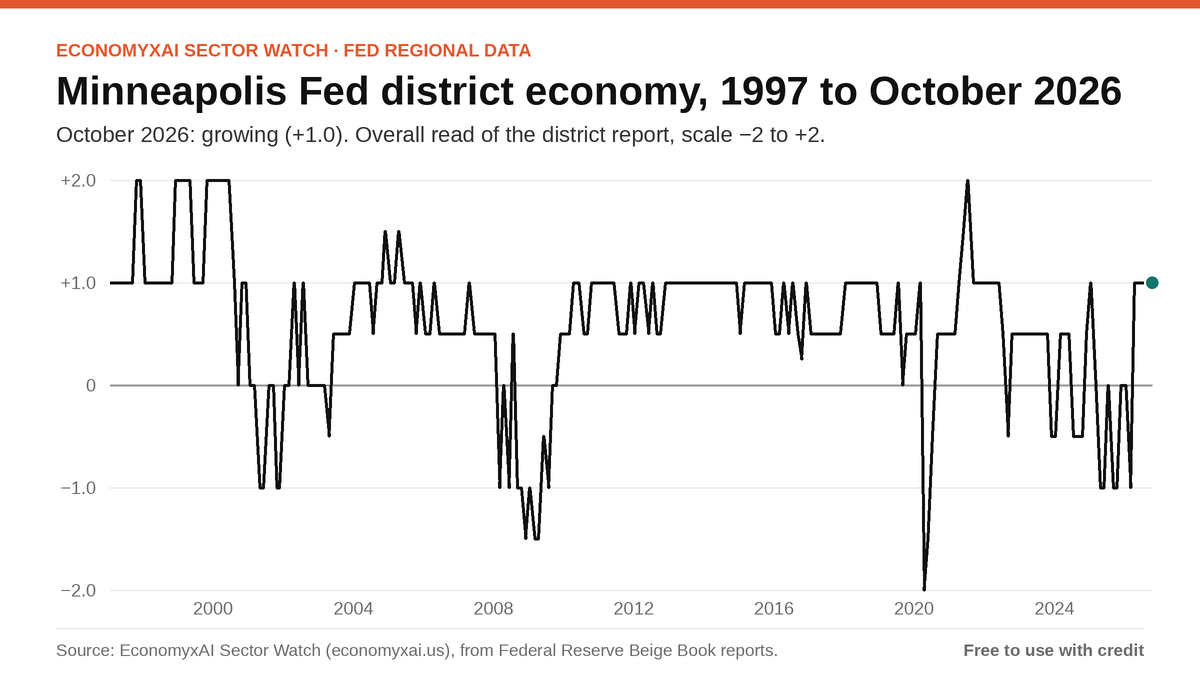
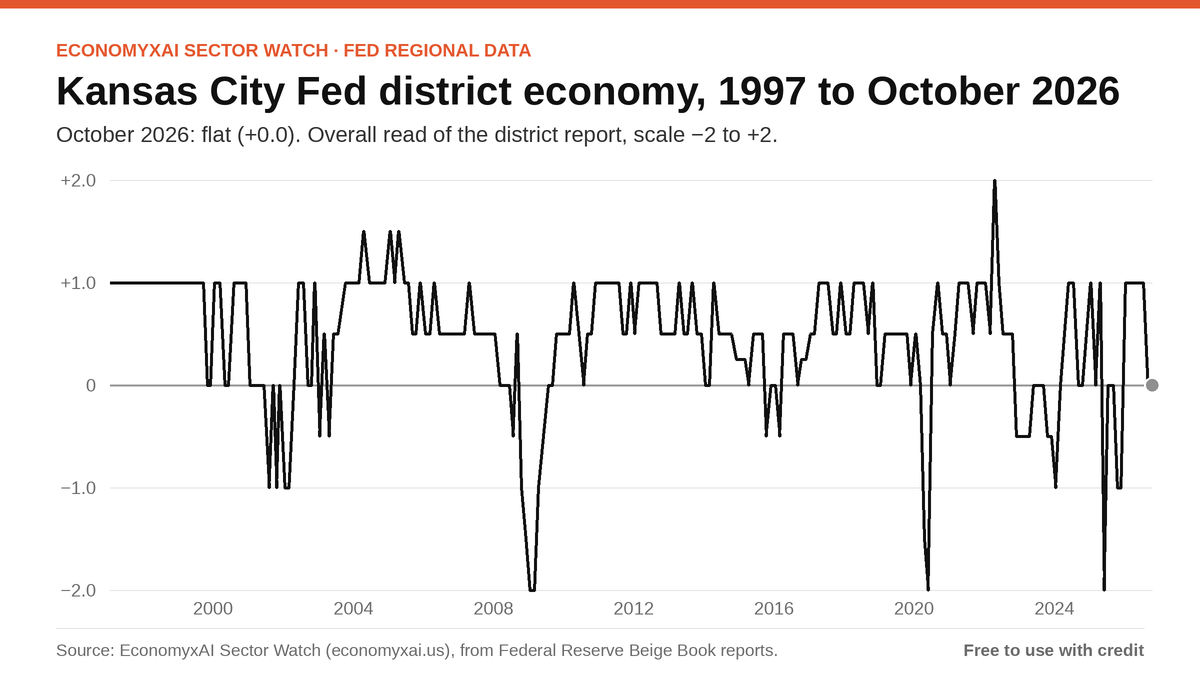
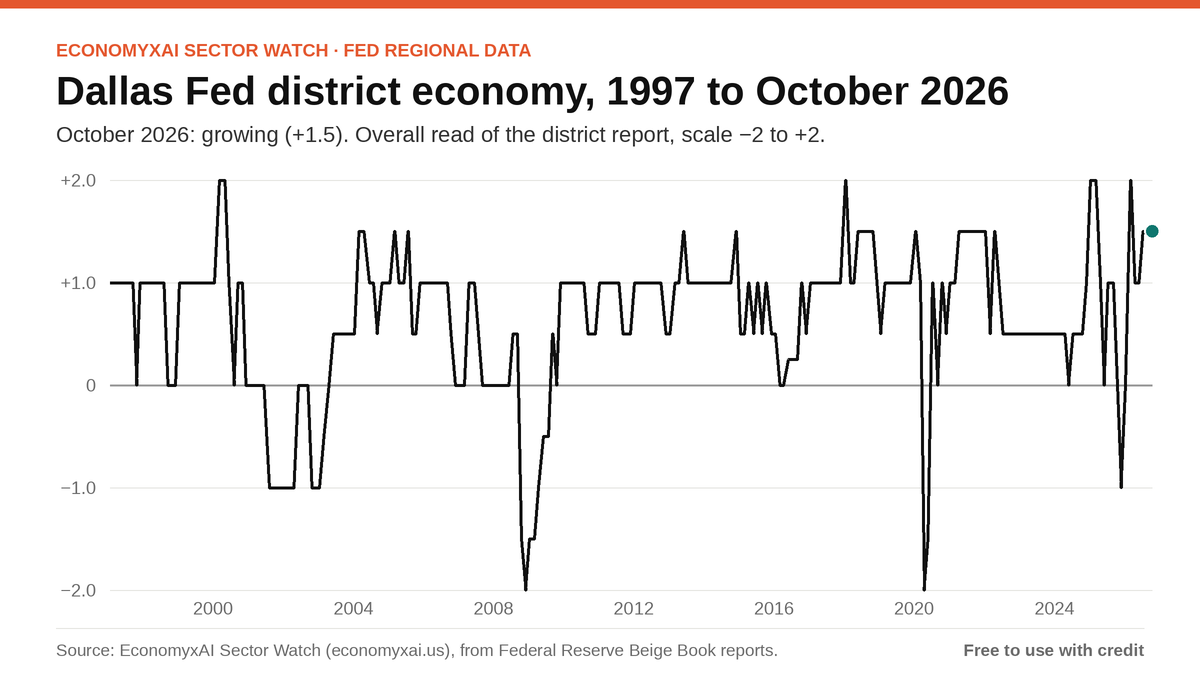
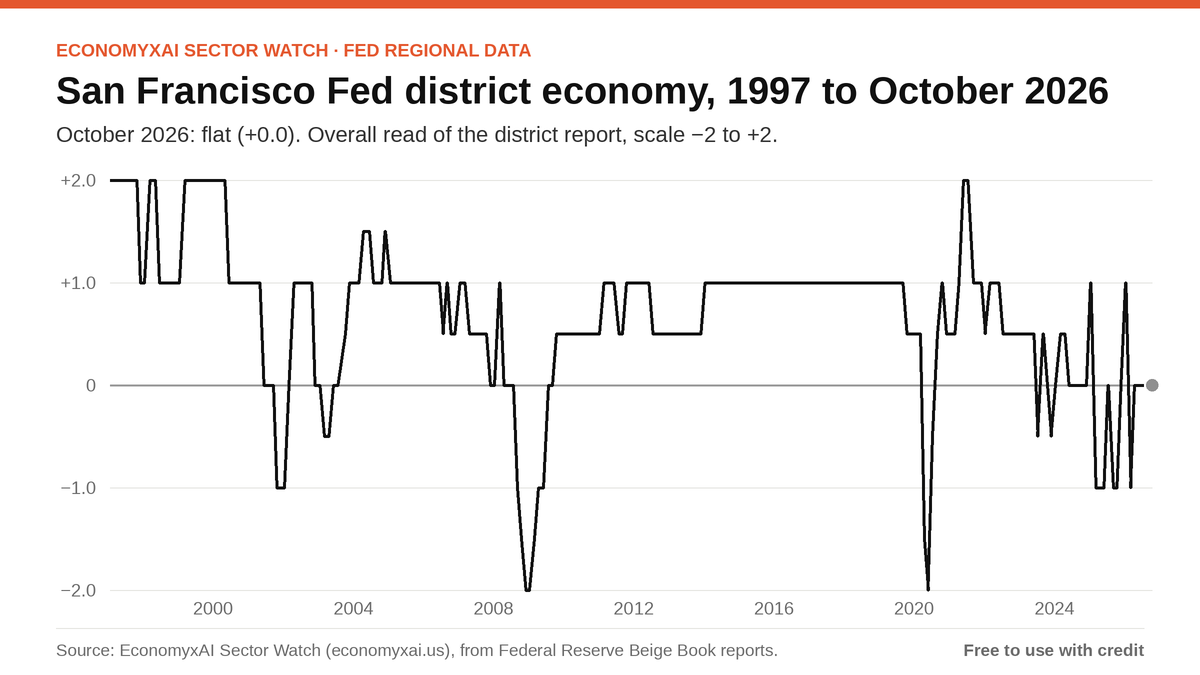
Sector Watch tracks how the 11 GICS sectors of the US economy and the 12 Federal Reserve districts are doing, now and over time. It scores every edition of the Federal Reserve’s Beige Book since 1997 (238 editions). The Beige Book is the Fed’s summary of business conditions reported to each of its twelve district banks, published eight times a year.
How it’s scored
Each district’s report is scored from −2 (strong contraction) to +2 (strong expansion), overall and for each sector. The district scores are combined, weighted by each district’s share of a sector’s activity, into a sector Prospect Score that blends current conditions, outlook and momentum. The scores are EconomyxAI’s interpretation of public Federal Reserve reports. They are not official Fed figures and not investment advice. Full details are on the methodology page.
Using our charts and data
You may use the charts below, and any figure on this site, in news coverage free of charge. Please credit “Source: EconomyxAI Sector Watch (economyxai.us)” and, online, link to the page the figure came from. We are glad to provide data tables or a custom chart for a story; just ask.
Release-day access
Reporters can get each new edition on Beige Book release day, before it appears on the website. Email us with your name and outlet to join the press list.
Contact
contact@economyxai.us. We aim to reply the same day, and quickly on release days.
Ready-made charts: sectors
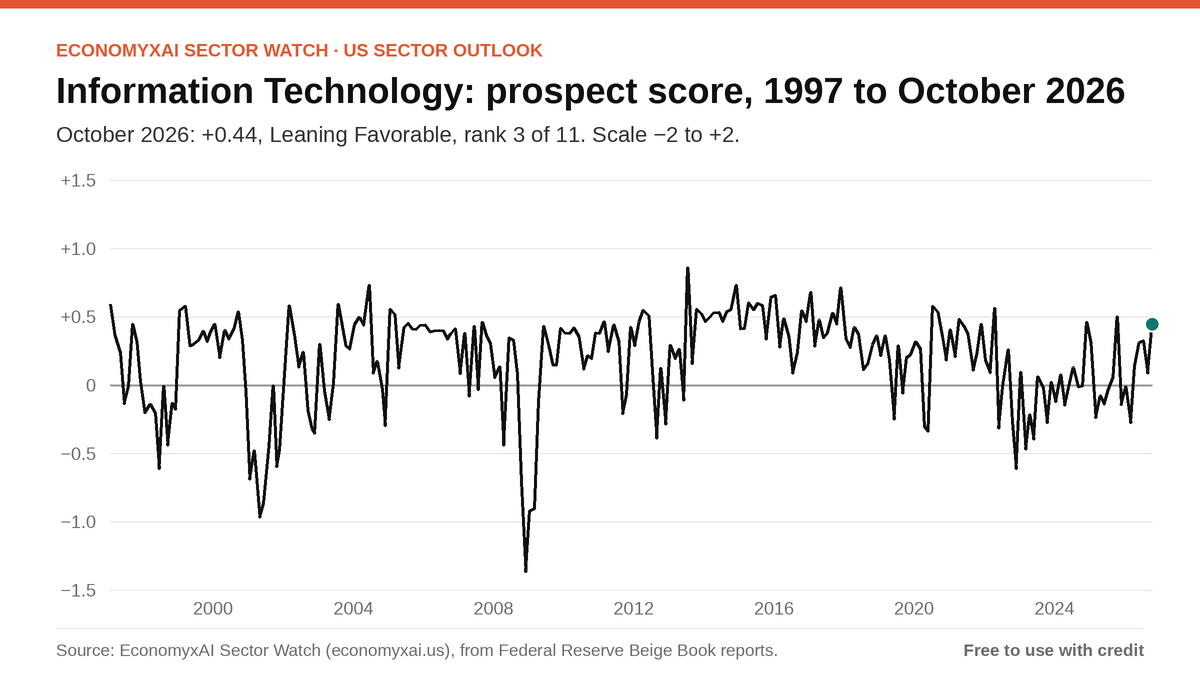
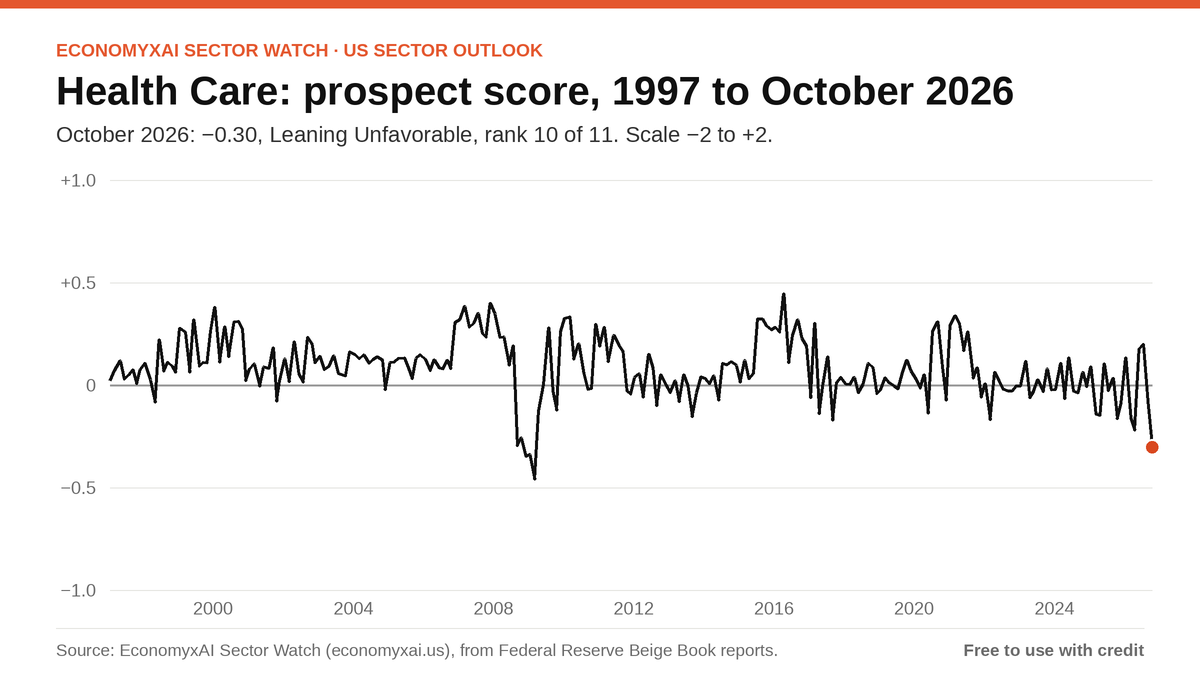
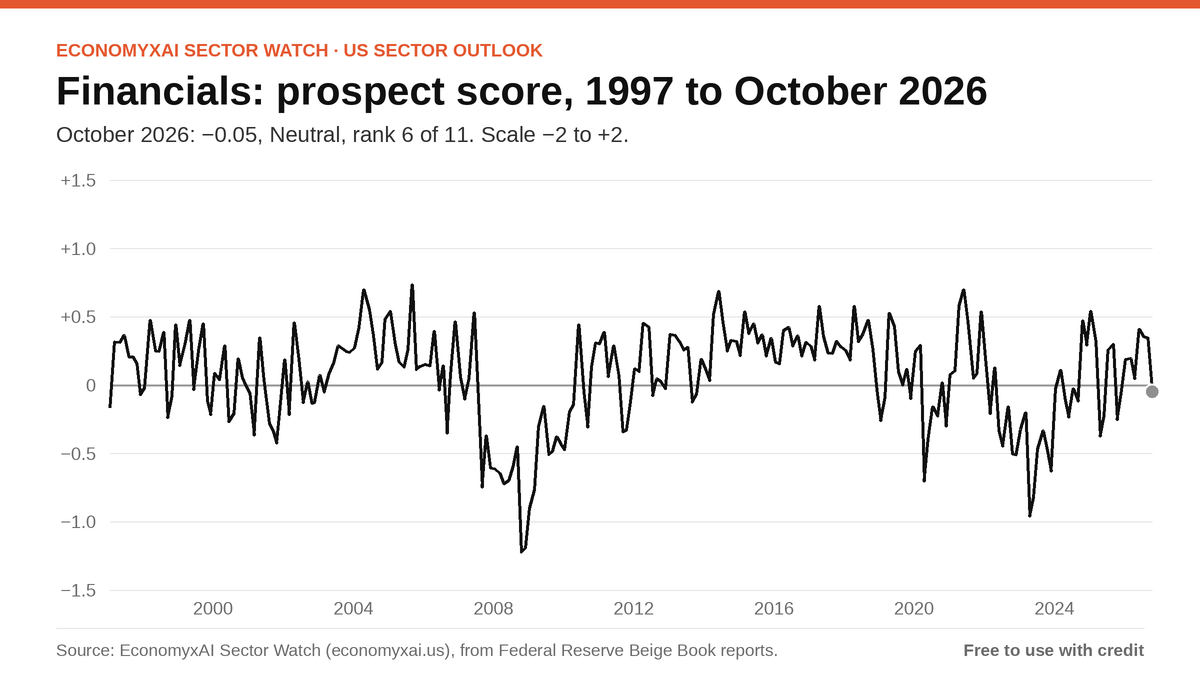
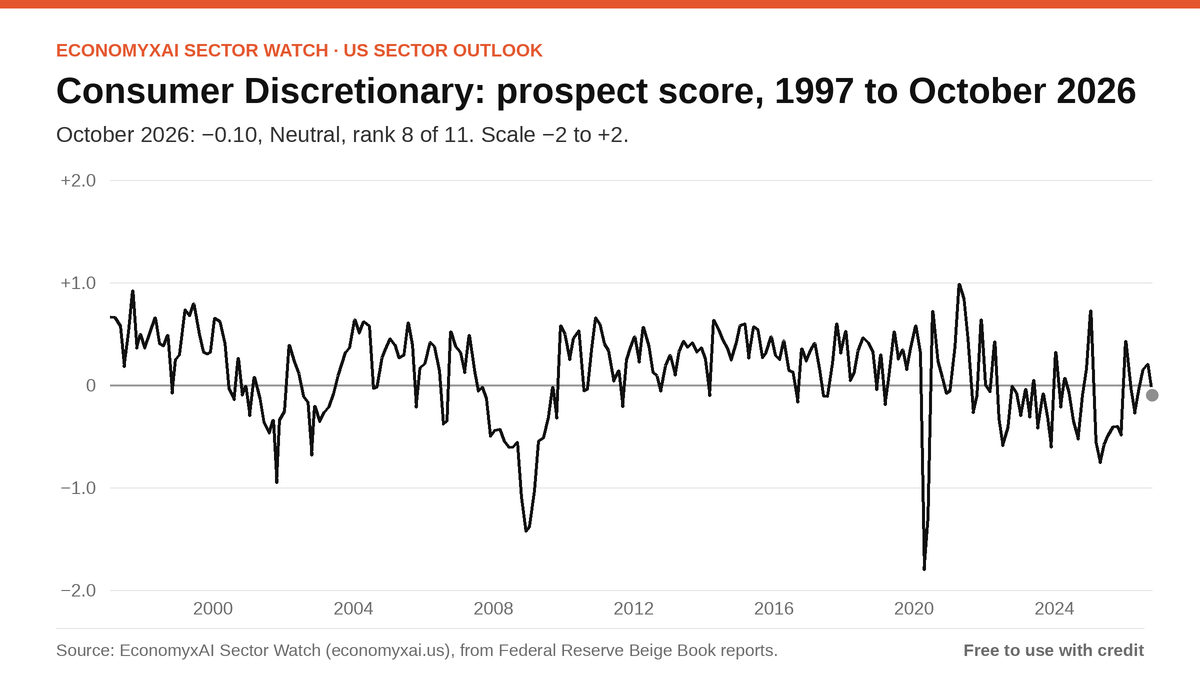
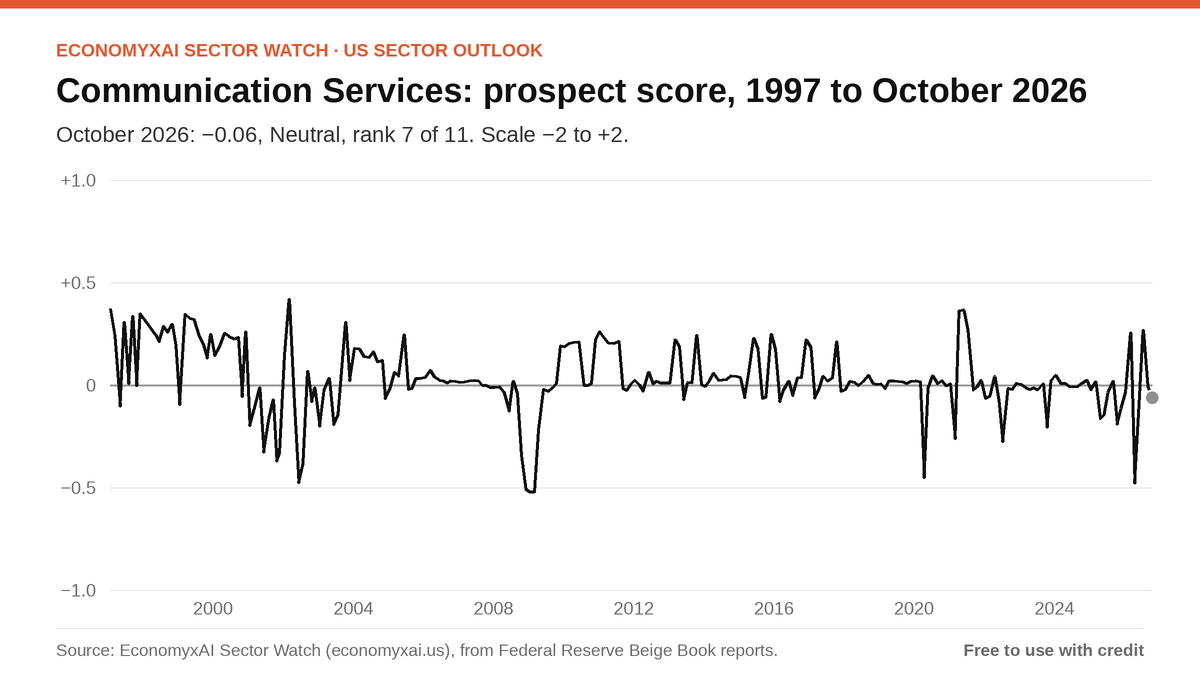
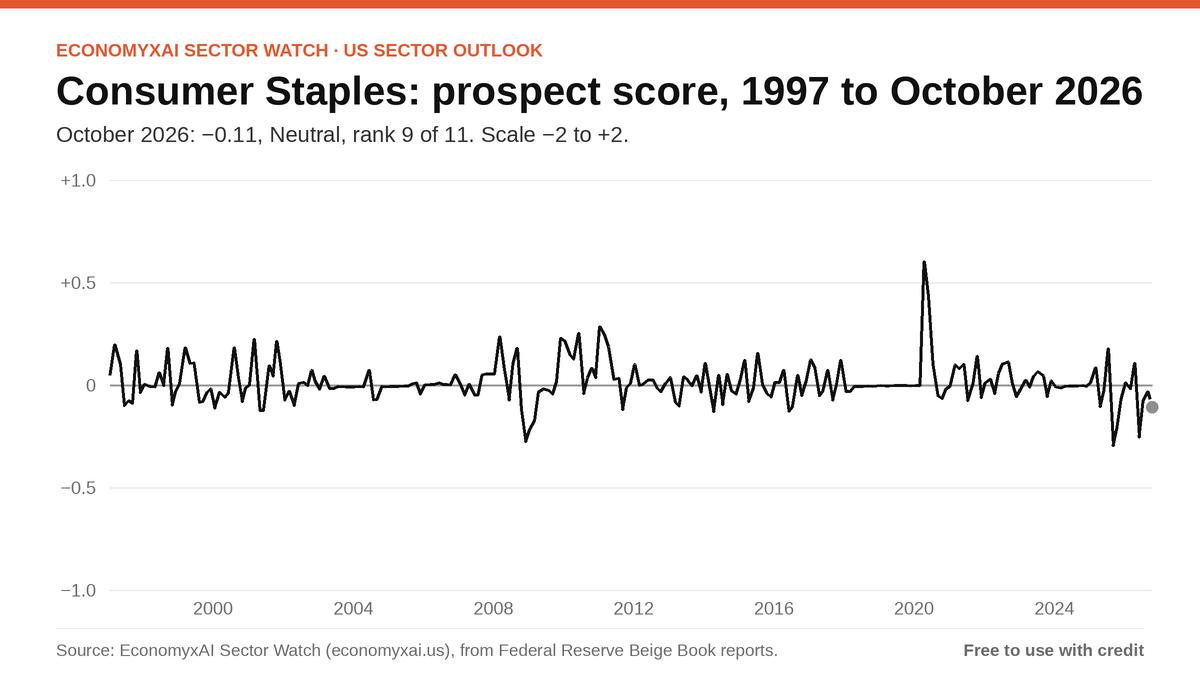
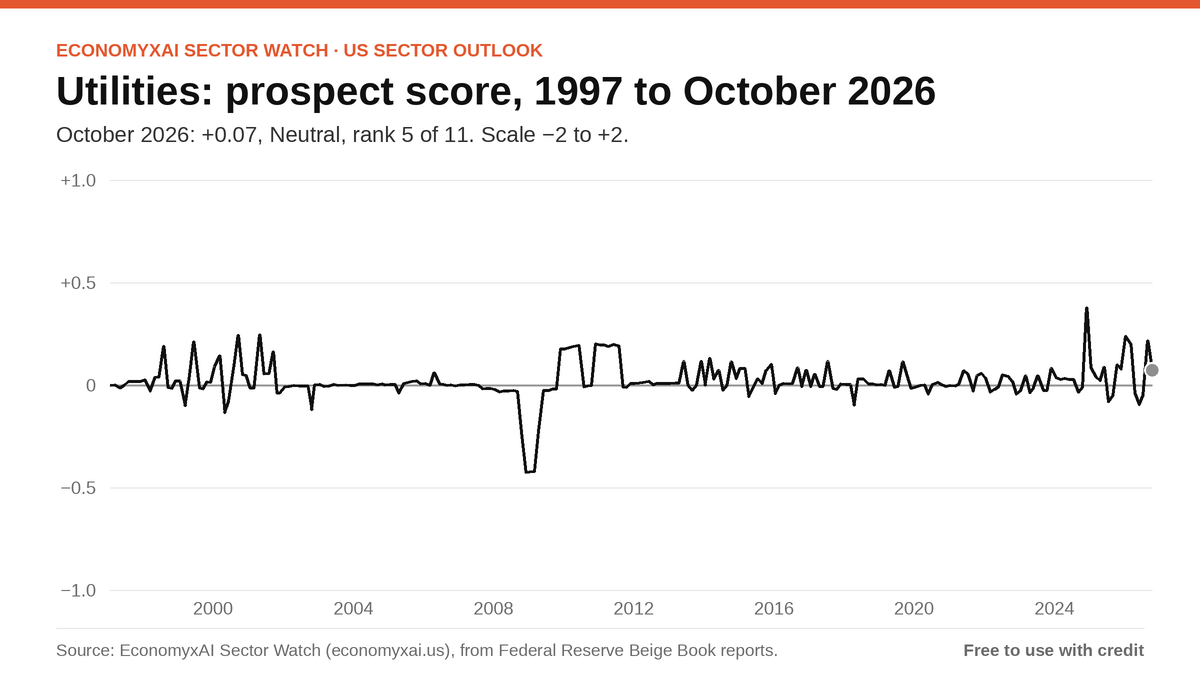
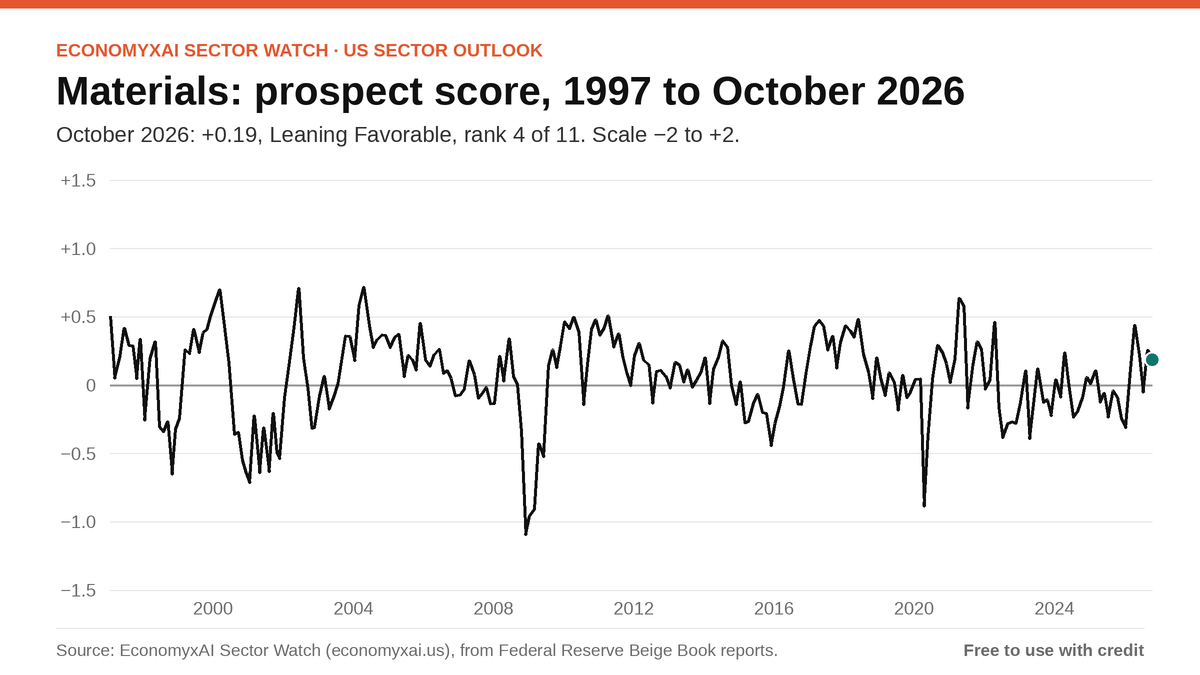
Each chart is a 1200×675 PNG covering every edition since 1997, updated with each release.
Ready-made charts: Fed districts